
By Andrew Babula, director of Real Estate Program at the University of St. Thomas, Opus College of Business; Brayden LeLoup, University of St. Thomas student, pursuing BS in Real Estate Studies; Madi Dulon, University of St. Thomas student, pursuing BS in Real Estate Studies
In recent years, there has been a notable decline in the occupancy rates of office buildings in metropolitan areas across the nation, attributed in part to the accelerated transition from traditional in-person office work to remote and hybrid models, propelled by the challenges posed by the Covid-19 pandemic.
A portion of this workforce has begun to return to physical office spaces as companies institute back-to-work policies and pandemic-related restrictions gradually begin easing. However, occupancy levels in office buildings continue to lag significantly behind pre-pandemic levels.
In Minneapolis, the Central Business District (CBD) has faced challenges regarding office occupancy, worsened by safety concerns during the pandemic era. These factors have exerted additional pressure on the city’s efforts to facilitate a post-pandemic return to traditional office environments. According to the Minneapolis Downtown Council, there was a 56% increase in employees and businesses returning downtown over the past year. CBRE puts the daytime working population at just 65% of what the daytime population was before the pandemic (CBRE Demographic Comprehensive 2023).
The transition to work-from-home and hybrid employment models has prompted organizations to reassess their office space needs, leading to a trend of downsizing, and subsequent sublease of the space, or eliminating office footprints upon lease expiration. Presently, office vacancies within the Minneapolis CBD sit at 27.3%, a significant increase from the 17.9% recorded in 2019 (Cushman & Wakefield Q4 2019 & Q4 2023 Minneapolis Office Marketbeat).
While the long-term ramifications of Covid-19 and safety concerns on downtown office dynamics remain uncertain, further reductions in office space are anticipated in the coming years as lease agreements expire. Investors and tax assessors evaluate the value of office buildings based on the net income generated by the property, which directly correlates with occupancy rates. Consequently, as occupancy diminishes within CBD office properties, so does the overall value of those properties. Moreover, given that property taxes are calculated as a percentage of property value, it follows that the decreased value of office buildings in the Minneapolis CBD will adversely affect the city’s tax revenue.
Indeed, numerous observers have drawn attention to the imminent impact on Minneapolis’s tax revenue, a topic extensively discussed both formally and informally. At the Real Estate Journal’s October 2023 Downtown Summit in Minneapolis, local professionals and policymakers engaged in deliberations concerning the future trajectory of the downtown area, particularly addressing concerns regarding the potential inability to salvage declining office building values. Furthermore, the issue of declining property values was highlighted in the City of Minneapolis’s assessment budget presentation for 2024. The city administration openly acknowledged the uptick in tax appeals, signaling a possible substantial reduction in taxable property values. Presently, over $10.5 billion worth of property is under petition in Minneapolis, with nearly $6.5 billion from 2023 alone. This represents nearly half of the city’s commercial tax base, indicating that the final assessed values may significantly differ from their current estimates.
However, to date, we have not seen any quantifiable estimation of the overall financial impact these reduced office building values are expected to have on the City of Minneapolis’s tax revenue. In this paper, we estimate the potential loss of tax revenue Minneapolis will face due to increased office vacancies from a subset of the largest office buildings downtown.
Key conclusions
Our analysis indicates that the City of Minneapolis is projected to incur a decline in tax revenue of nearly $10.5 million due to declining values of “Class A” office buildings in the Minneapolis Central Business District. This $10.5 million reduction in tax revenue is a direct result of a decline in property value of approximately $1.65 billion and equates to just under 1% of the city’s total budgeted revenue of $1.7 billion. It is important to note that the term “city” refers to only taxes collected for the City of Minneapolis directly and not the City of Minneapolis Park Board.
Given the volume of tax appeals outstanding for the year 2023, we are likely to see this impact on taxes collected in 2024 and in subsequent years. The reduction in assessed values means that the tax revenue that the city and other jurisdictions collect on these buildings will be lower than previous collections, the mil rate for the jurisdiction will increase, or some combination of the two. An increase in the mil rate adds more expenses to the building owner, making the investment less attractive, leading to fewer investors putting their money in the city of Minneapolis.
Approach
Our analysis relies on the valuation principle of substitution and the comparative approach to appraisal. More explicitly, we employed a method wherein we ascertained the fair market value by examining the recent sale of the LaSalle Plaza in downtown Minneapolis and compared these figures to their most recently assessed values. This enabled us to quantify the loss of value incurred by such properties. By then using that metric as a proxy for the percentage reduction in value of comparable downtown office properties, we estimated the total loss in value and, by extension, the loss in tax revenue generated by those properties.
In 2023 (payable 2024), the Minneapolis assessor’s office valued LaSalle Plaza at $87 million. However, the property sold for $46 million in June of 2023, indicating a 48% reduction in value between the assessed value and the actual sale price. This 48% reduction in value is applied uniformly across comparable office buildings.
This analysis does not aim to quantify the entirety of the change in taxable values for office properties across the City of Minneapolis, nor does it encompass all office properties in the Minneapolis Central Business District (CBD). Instead, our focus is narrowed to a subset of office properties in the CBD where a comparison to LaSalle Plaza is feasible.
The geographical delineation of the area used (CBD) is defined by the Mississippi River to the north, Interstate 35W to the east, Interstate 94 to the south, and Interstate 394/2nd Avenue to the west. Within this area, we selected only Class A office properties which we defined as those designated by CoStar as 4- and 5-star office buildings. Application of these parameters resulted in a list of 39 properties included in our analysis, collectively compromising just under 25 million square feet of leasable space. This subset constitutes more than 70% of the overall office space within the Minneapolis CBD.
Data from recent trades on Minneapolis office properties are limited. Other than LaSalle, there were two recent sales in downtown Minneapolis, RBC Gateway and the NorthStar Center. RBC Gateway is excluded from this analysis as it is a new construction and therefore not typical of other downtown officed properties. The NorthStar Center was purchased for $6.2 million in May 2023 for redevelopment into multifamily residential. The 2022 (payable 2023) assessed value of NorthStar Center was $47.1M. The $40.9M decline represents an 87% reduction in value.
While this reduction may suggest that market values have declined even more than our 48% estimate, we consider NorthStar Center to be an outlier. Given its age (1960s build), poor condition, and extreme vacancy, we don’t consider NorthStar Center a good property to use as a comparable for other class-A, downtown office properties.
While the application of a 48% reduction in value is based solely on the change in value of a single property transaction, this is a logical, if conservative, estimate to use for comparable properties. In the future we may have more transaction data to refine our analysis with Wells Fargo Center and Capella Tower both on the market, however for now, the LaSalle trade is the best data available. The LaSalle Plaza transaction was a fair market transaction of a typical office property in downtown Minneapolis and the highest and best use of the property remains as office (with ground and skyway level retail).
We only included buildings in the same central location (CBD), similar size, and similar class (A) in this analysis. LaSalle Plaza’s vacancy was approximately 30% compared to an average 24% vacancy rate for all other properties analyzed. While the overall lower vacancy rate of the subject properties suggests they may maintain their values better than LaSalle Plaza, we do not consider this difference in vacancy enough to materially impact our value estimates. Further, many of these properties have many leases expiring in the near term, suggesting that vacancies will increase given most tenants are renewing into smaller footprints.
Analysis
Our analysis encompassed 39 Class A CBD properties ranging from 100,000 SF to 1.9 million SF. These properties had 2023 assessed values ranging from $9.5 million to $253 million. The buildings that meet the above criteria are shown as blue pins in Figure 1. The total 2023 assessed value (2024 payable) of these 39 buildings is approximately $3.5 billion. Applying a 48% reduction in value equals a $1.65 billion loss and puts the new total value at approximately $1.85 billion. The current mill rate (tax rate) on these properties is 31 ($31 in annual tax for every $1,000 of assessed value). This is broken down into City at 6.30, Park Board at 1.36 County at 4.78, State at 6.00, School at 3.70, Metropolitan Council at 0.25, Special at 0.48, and Fiscal Disparity (which supports Twin Cities metro areawide communities) of 8.10.
This implies that for the properties included in this analysis, the estimated tax revenue payable in 2024, based on the 2023 assessed values will be nearly $22 million for the city of Minneapolis alone. However, if we apply our 48% reduction to the current assessed values of these buildings, the city will receive $11.3 million in tax revenue, representing a nearly $10.5 million reduction in city revenue for 2024.
In addition to the City of Minneapolis, other taxing jurisdictions will face similar tax revenue declines. The state has the potential to lose $10 million in tax revenue from these 39 Class A office properties. Hennepin County is set to lose approximately $8 million; the Minneapolis School District may face a loss of over $6 million in tax revenue. Other jurisdictions including the Metropolitan Council and communities that benefit from Fiscal Disparities could collectively face $15 million in lost tax revenue. Across all jurisdictions, we estimate a revenue loss of over $51 million per year.

Figure 1 Blue Pins are buildings in analysis. Grey pins are office buildings that do not meet our criteria.
Potential limitations
Applying a single value reduction percentage to all 39 properties reviewed is perhaps an overly simplistic approach to valuation and has some limitations. Assessors rely on many more data points and conduct more in-depth analyses on each individual property to determine an appropriate assessed value. Furthermore, property values do not all decline at the same rate. Certain properties, those better positioned to weather the downturn due to condition, management, location, amenities, etc., may not see occupancy, and therefore value, drop as severely as it did at LaSalle Plaza. Conversely, many properties will struggle even more than LaSalle Plaza to maintain occupancy and rents and could therefore exceed a 48% value reduction. Despite the various nuances that exist for individual properties, we are comfortable using a 48% value reduction based on LaSalle Plaza given that, in aggregate, it represents an appropriate indication of the market. It is the best, if not only, appropriate current comparable for assessors and appraisers to use.
Implications
It is insufficient to dismiss the loss in property values that is occurring as merely misfortune affecting building owners and investors; the repercussions extend far beyond that limited scope. The revenue generated through property taxes from these buildings is instrumental in supporting the city and progressing it forward. The funding received from its largest office buildings is influential in enabling the city to undertake vital projects and administer programs for the benefit of its citizens.
With a total budget of $1.72 billion (2024), a $10.5 million reduction in tax revenue represents a 0.62 percent decrease in revenue for the City of Minneapolis. This percentage reduction is perhaps less than many may have expected given the discussions and reporting around the calamitous situation with downtown office space. Still, a 0.62 percent drop in revenue on top of the loss of American Rescue Act funds and increasing expenses due to high inflation, presents a challenge that city leaders will need to address.
It is also important to remember that this $10.5 million reduction in tax revenue comes from only the 39 properties included in our analysis. Extending this analysis to all other office properties in Minneapolis (Class B and C offices and all those outside the CBD), many of which arguably will face even more extreme valuation reductions, would result in an even greater projected loss in tax revenue for the city. The monetary impact can be widespread, as diminished resources limit the city’s capacity to provide basic services, implement social programs, and support infrastructure projects.
When the city grapples with financial constraints, such as the one presented in our findings, it adversely affects the collective well-being of its citizens and visitors. With such a decrease in revenues due to the loss in property taxes, the deficit will presumably be passed along to the consumers and citizens within the city. How leadership should manage this loss in revenue falls outside the scope of this analysis, though it can reasonably be expected that the budget shortfall would need to be resolved through additional budget cuts and/or increased taxes on other property owners.
The objective of this research and analysis is not to sensationalize nor to present an alarmist scenario. Instead, it is an earnest effort to provide a measured assessment of the potential impact resulting from the decrease in office tower values in Minneapolis. Through the dissemination of this information, our objective is to foster collaboration between city officials and other key stakeholders facilitating awareness and action. These initiatives are pivotal in addressing the adverse effects stemming from the challenges confronting office buildings.
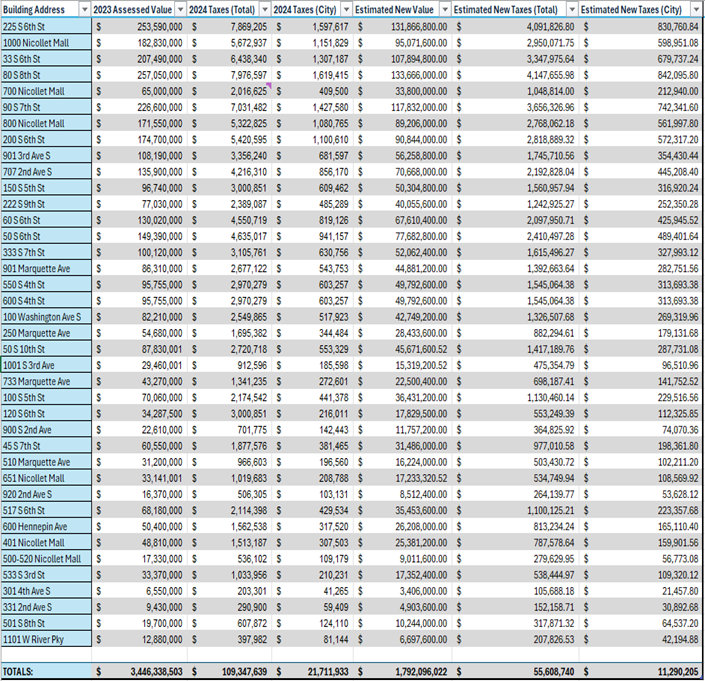
Figure 2 Office Building Values and Tax Amounts (Source: Hennepin County GIS)