During the second half of 2018, capitalization rates broadly remained stable, buoyed by a trio of macro factors—positive economic growth, abundant capital and a favorable supply/demand environment. This held true in the Chicago market, where only industrial saw a modest drop.
“Investment activity remains robust, driven by a strong economy, significant amounts of capital, and a sense that supply and demand in real estate markets is very well balanced,” said Richard Barkham, global chief economist, CBRE. “The U.S. remains the best performing of the advanced economies, due to job growth and earlier tax cuts.”
According to the CBRE North America Cap Rate Survey, industrial cap rates tightened marginally across all segments in H2 2018, while office, multifamily and hotel cap rates generally remained stable. This trend is expected to continue in H1 2019, with multifamily and retail sectors experiencing the most mixed sentiment.
“Cap rates were very stable in 2018, and pricing firm. We see this situation continuing in 2019, with a weaker global economy putting downward pressure on the 10-year treasury,” said Barkham, adding that he expects real estate spreads to remain very competitive.
Industrial
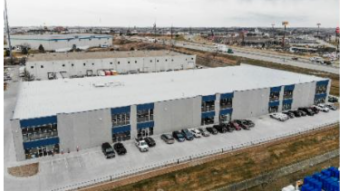
Industrial and logistics cap rates declined by 7 bps to 6.34 percent for acquisitions of stabilized assets in H2 2018. Cap rates for stabilized properties of all classes fell, with Class A industrial properties declining 7 bps to 5.07 percent, Class B falling 13 bps to 5.98 percent and Class C down 2 bps to 8.02 percent.
Chicago experienced a significant drop in both Class A and B cap rates, which each fell 25 bps to 4.75 percent and 5.88 percent, respectively—putting them both below the national average. The needle didn’t move on Class C space, which recorded a 9.13 car rate throughout the year.
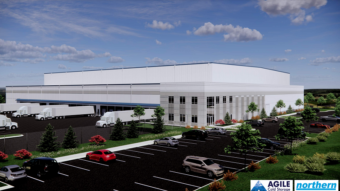
“Investor demand in Chicago remains very robust,” said Ryan Bain, senior vice president, capital markets, CBRE. “We expect core cap rates to hold or compress slightly in 2019. We will likely see more compression with Class B properties, especially in tight, infill markets and in alternative uses such as cold-storage and high flow-through facilities.”
Office
Office properties located in downtown cores experienced greater cap rate increases than their counterparts in the suburbs—especially in Tier I markets—with suburban cap rates flattening across all classes and investment strategies. According to the CBRE survey, cap rates should remain unchanged in approximately three-quarters of CBD markets and two-thirds of suburban markets in H1 2019.
“Liquidity remains ample and will continue to fuel office acquisitions in 2019. For assets deemed to be reasonably priced, bidding pools are wide and deep,” said Chris Ludeman, global president, capital markets, CBRE. “Continued strength of property fundamentals, balanced occupier demand and supply, robust capital flows and accommodative pricing of debt and equity all combined to ward off material expansion in yields.”
In the Chicago suburbs, office cap rates in the second half of the year didn’t budge from the 9.34 percent of H1 2018. Class A suburban space, recorded at 8.38 percent, also stayed the same all year. The same was true for Class A space in the CBD, which stayed at 6.00 percent throughout 2018. Class C CBD office space saw the greatest change of any property type across the metro, increasing 50 bps to 8.25 percent between H1 and H2 2018.
Multifamily
“Multifamily cap rates were largely stable in H2 2018 and overall market sentiment continues to be positive,” said Brian McAuliffe, president, capital markets, CBRE. “Headwinds that were expected to moderate sales last year, such as rising interest rates and additional supply in some markets, had little impact.”
Cap rates and returns on cost both remained at historically low levels in H2 2018 for multifamily assets. Infill stabilized properties averaged cap rates of 5.26 percent and expected returns on cost for infill value-add acquisitions averaged 6.00 percent. Meanwhile, suburban stabilized assets priced at 5.56 percent on average with expected returns on costs averaging 6.30 percent.
“The sector offers an attractive pricing environment and predictable cash flow. Investors continue to move out the risk curve to find new opportunities and greater yields,” said McAuliffe.
In Chicago, all infill multifamily properties edged up. Class A space was up 13 bps to 4.75 percent, Class B was up 25 bps to 5.13 percent and Class C increased by 13 bps to 5.88 percent in H2 2018. Class B and C suburban stock was stable throughout the year at 5.3 and 6.38 percent, respectively, while Class A increased to 5.25 percent, up from 5.13 percent in H1 2018.
Hospitality
Hotel cap rates were mostly stable in H2 2018, with increases of only 3 bps or less on average for all CBD and suburban submarkets. The CBD hotel cap rate remained below 8 percent and was under the long-run average. Suburban cap rates moved up 1 bp to 8.49 percent. Most market segments and geographic areas had quite modest, single-digit upticks or downticks in cap rates ranging from minus 2 to plus 9 bps.
“Hotel sector fundamentals have offered few, if any, surprises. This, combined with continued high liquidity in the debt markets, has allowed for relative stability in cap rates,” said Kevin Mallory, global head and senior managing director, CBRE Hotels. “While one might anticipate upward pressure because of late cycle fundamentals and some volatility in the capital markets, the weight of capital focused on the sector has kept cap rates in check.”
Suburban Chicago hotel properties followed national trends, showing no change between the first and second half of 2018, while CBD properties showed a little more volatility. Luxury product in the suburbs stayed at 8.13 percent while CBD luxury hotels increased 12 bps to 7.25 percent. Full service and select service CBD properties—8.25 and 8.63 percent, respectively—were unchanged though economy assets increased 25 bps to 9.75 percent in the downtown core.
Retail
In markets across North America, retail cap rates for both stabilized and value-add properties increased for all retail segments in H2 2018. Chicago was an anomaly, showing no change between the first and second halves of the year.
Recent store closure announcements have disproportionately affected the power center segment in the United States and Canada, with the average cap rate increasing by 13 bps to 8.42 percent in H2 2018. Demand for high-quality assets was strong, with cap rates for Class A product in all three retail sectors the lowest, ranging from 4.83 percent to 8.42 percent.
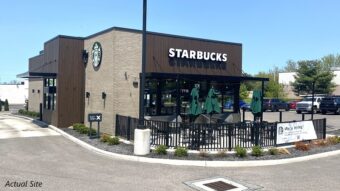
In Chicago, all power centers recorded an 8.67 percent cap rate, with Class A, B and C notching 7.13, 8.38 and 10.50 percent, respectively. Class A neighborhood/community centers stayed at 5.75 percent all year; Class B and C neighborhood/community centers also remain unchanged at 7.25 and 9.13 percent, respectively.
Cap rates for stabilized power centers, as well as neighborhood/community center properties, should remain unchanged or increase slightly in H1 2019 across North America.


