Throughout 2018, construction costs rose around the nation at an average of approximately 5.73 percent. Among 14 tracked markets in North America, no market had a larger increase in construction costs than Chicago, where last year they rose by 7.61 percent.
According to the latest quarterly cost report for North America from Rider Levett Bucknall (RLB), a Phoenix-based International property and construction consultancy firm, Portland (7.13 percent), San Francisco (6.73 percent) and Phoenix (6.70 percent) were the next-largest markets in the comparative cost index. The report also suggested that, while most markets they surveyed were at or approaching the peak of their construction activity cycle, Chicago was the lone market considered to be in mid-decline.
Though Chicago saw the largest annual increase in costs, the actual per-square-footage price tag to build was higher in other markets, depending on the asset type. Hard construction costs for prime office space, for example, ranged between $280 and $450 per square foot of gross floor area, higher than the average across the 12 U.S. markets of $258 to $396—but far from the $400 to $600 range in New York.
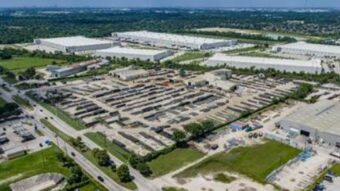
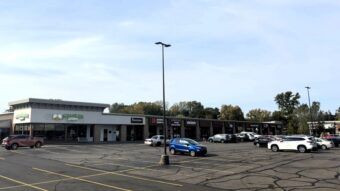
The $110 to $185 range for industrial construction hewed close to the national average ($107 to $168) though it’s costlier to build warehouses in Honolulu ($145 to $230), San Francisco ($150 to $200) and other markets. Multifamily space topped out at $400 per square foot of gross floor area in Chicago, well behind San Francisco ($520). Building a retail shopping center in Chicago, according to the RLB report, costs between $185 and $290, while a strip center ranges from $135 to $220.
According to the U.S. Department of Commerce, construction put in place during January 2019 was estimated at a seasonally adjusted annual rate of $1.27 trillion, which is 1.3 percent higher than the revised December 2018 estimate. Construction unemployment saw a bump of 1 percent over the last quarter of 2018, consistent with cyclical patterns which reflect a slowdown in construction during winter months.
The report also takes a look at indicative construction costs for 15 building typologies in each market, citing the high/low hard costs per square foot in eight major sectors. This data can form the basis of compelling comparisons of cost across regions and/or sectors. Sectors surveyed include housing (multifamily and single-family), retail (strip and central configurations), office (prime and secondary), hospitality (three- and five-star hotels), hospitals, warehousing, parking (ground level and basement facilities) and the full range of education projects, from kindergarten through college.
Placing the rising construction costs in context, the U.S. Gross Domestic Product closed out 2018 at 2.6 percent, down from the mid-year peak of 4.2 percent but back up to 3.2 percent for the first quarter of 2019. The Architectural Billings Index remains in positive territory at 50.4, indicating a slight decline in growth for architectural firms. Following the cyclical trend of higher unemployment rates in the construction industry during the winter season, construction unemployment stands at 5.1 percent.
The data in the report was current to January 1, 2019 and features construction cost information on 12 American and two Canadian markets, providing a statistical view of the state of the construction industry. The list of markets surveyed included Boston, Calgary, Chicago, Denver, Honolulu, Las Vegas, Los Angeles, New York, Phoenix, Portland, San Francisco, Seattle, Toronto and Washington, D.C.